
If you work with video files, you probably know ffprobe. It's the go-to tool for inspecting what's inside an MP4 — codec details, track layout, bitrates, container structure. It's powerful, and it's everywhere.
It's a lot of tool for what's often a simple question.
Between the flags, the jq piping, and the wall of JSON output, getting one answer often takes longer than it should.
Video Commander is a desktop app built for exactly this kind of work. This post walks through how to inspect an MP4 file visually — everything you'd normally reach for ffprobe to get, without leaving the terminal open.
Opening a File
Drop an MP4 onto the app window or use File → Open. Video Commander loads it as a new source tab and takes you straight to the Inspect view.

The Overview tab gives you the at-a-glance summary: container format, duration, file size, and a breakdown of each track — video codec, resolution, frame rate, bitrate, audio codec, sample rate, channel layout. The stuff you'd normally get from ffprobe -v quiet -print_format json -show_streams.
Exploring the Box Structure
MP4 files are made up of nested boxes (also called atoms). The moov, trak, mdia, stbl, and dozens of other boxes define everything about how the file is structured and decoded. Understanding this layout matters when you're debugging playback issues, validating encoder output, or just trying to understand what a file actually contains.
Video Commander gives you two ways to explore it.
Box Tree
The Tree tab renders the full box hierarchy as a navigable tree. Expand any box to see its children, and select a box to inspect its parsed fields in a detail panel on the right.
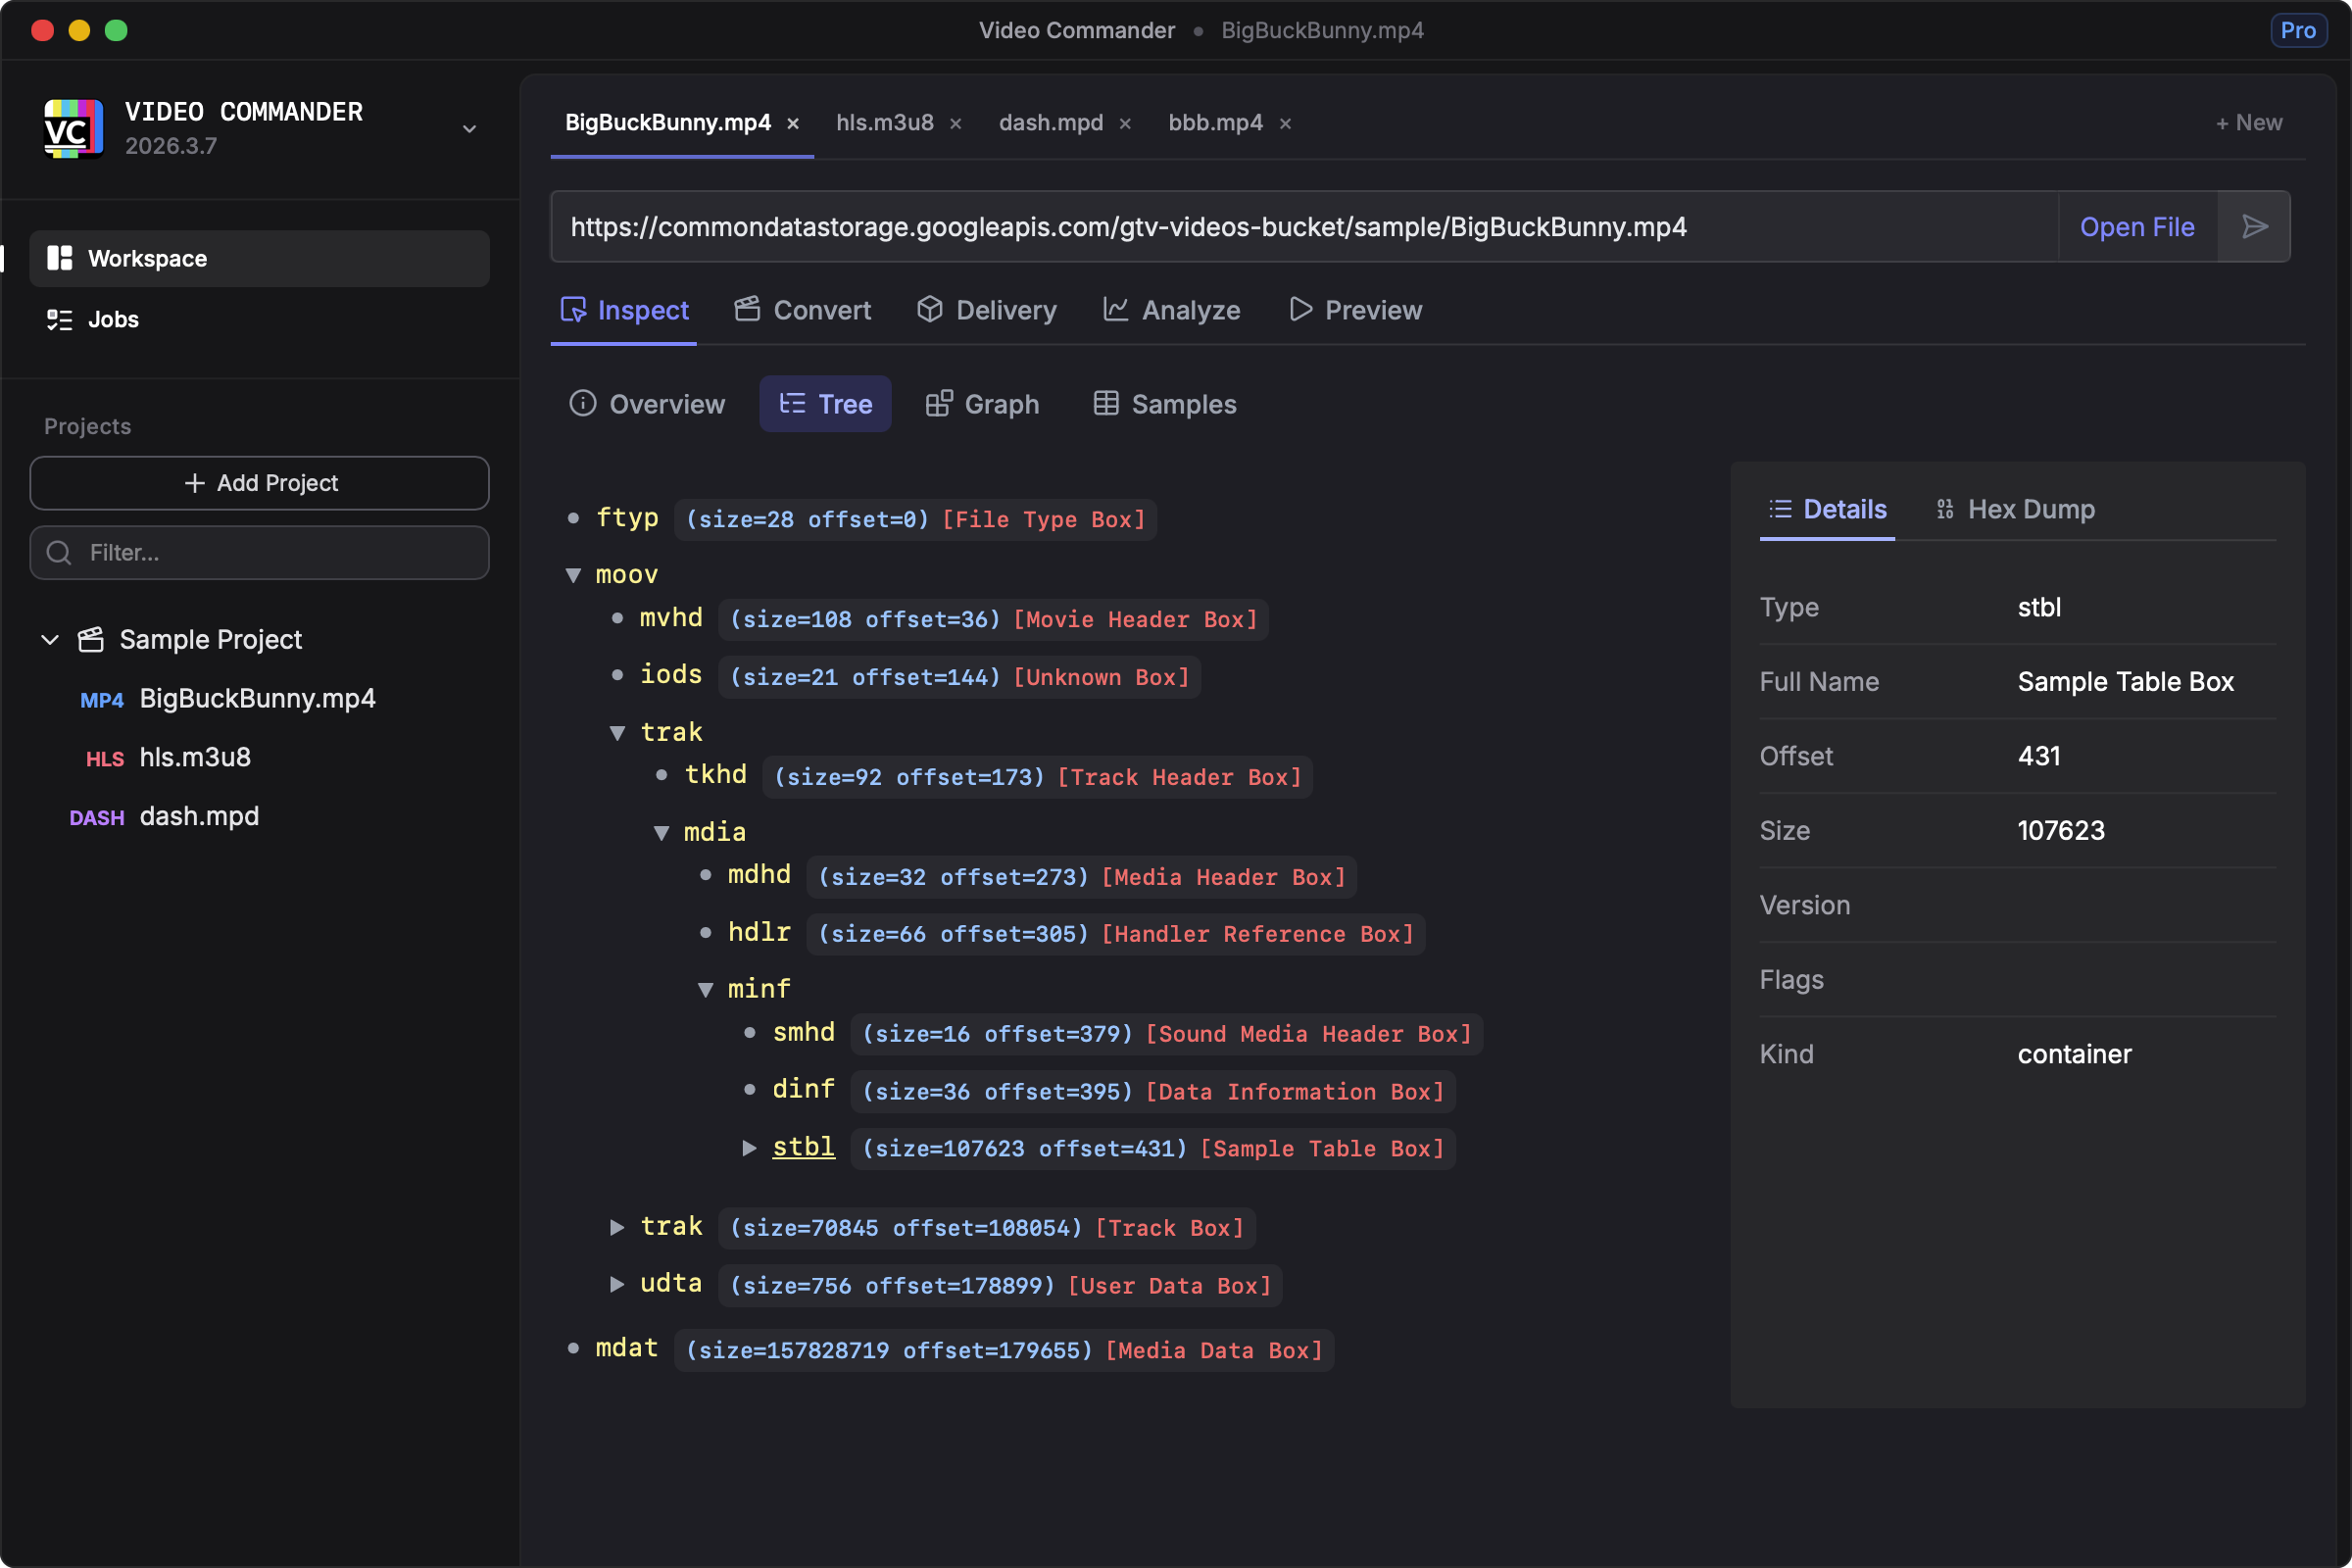
This is the equivalent of running mp4box -info or writing a custom parser — but you can click around in seconds instead of reading raw output.
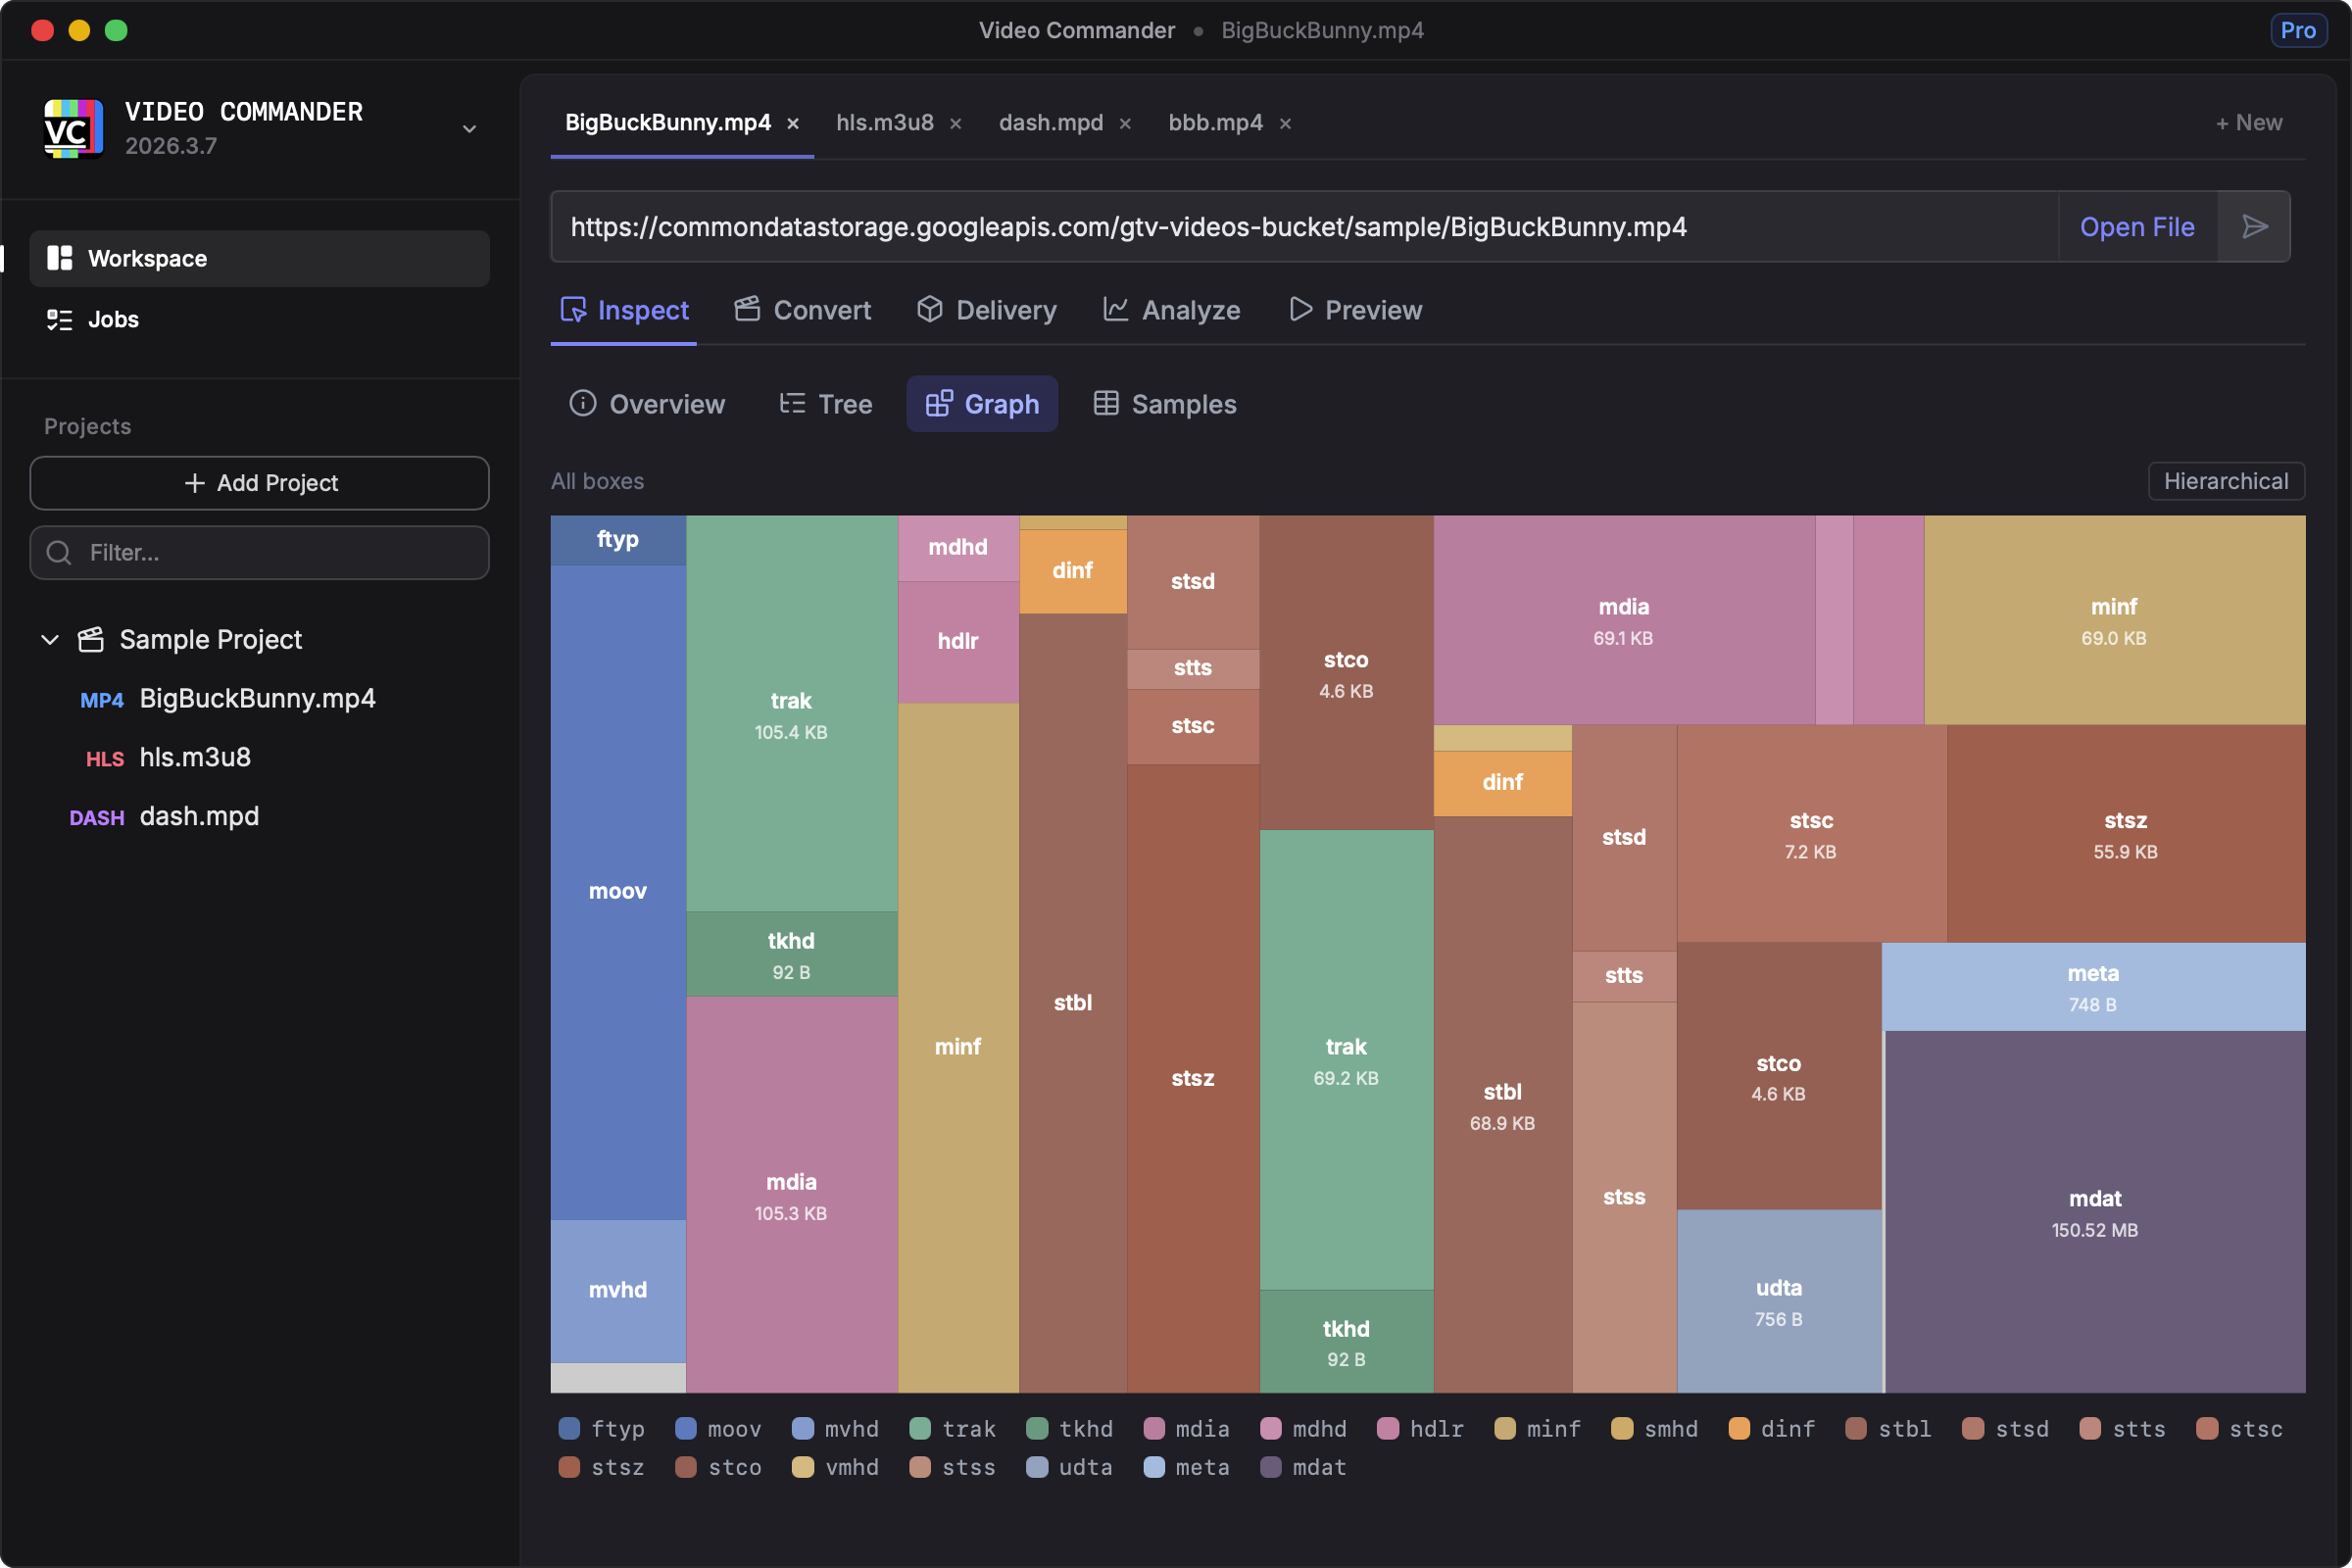
Box Graph
The Graph tab renders the same structure as a node graph, which is useful for understanding the relationships between boxes rather than just their nesting depth. You can drill into any node and right-click to load a subtree into focus.
Track and Sample Analysis
Beyond the container structure, the Samples tab lets you dig into the actual media data. Select a track and browse its sample table — timestamps, durations, sizes, sync points, and byte offsets into the file.
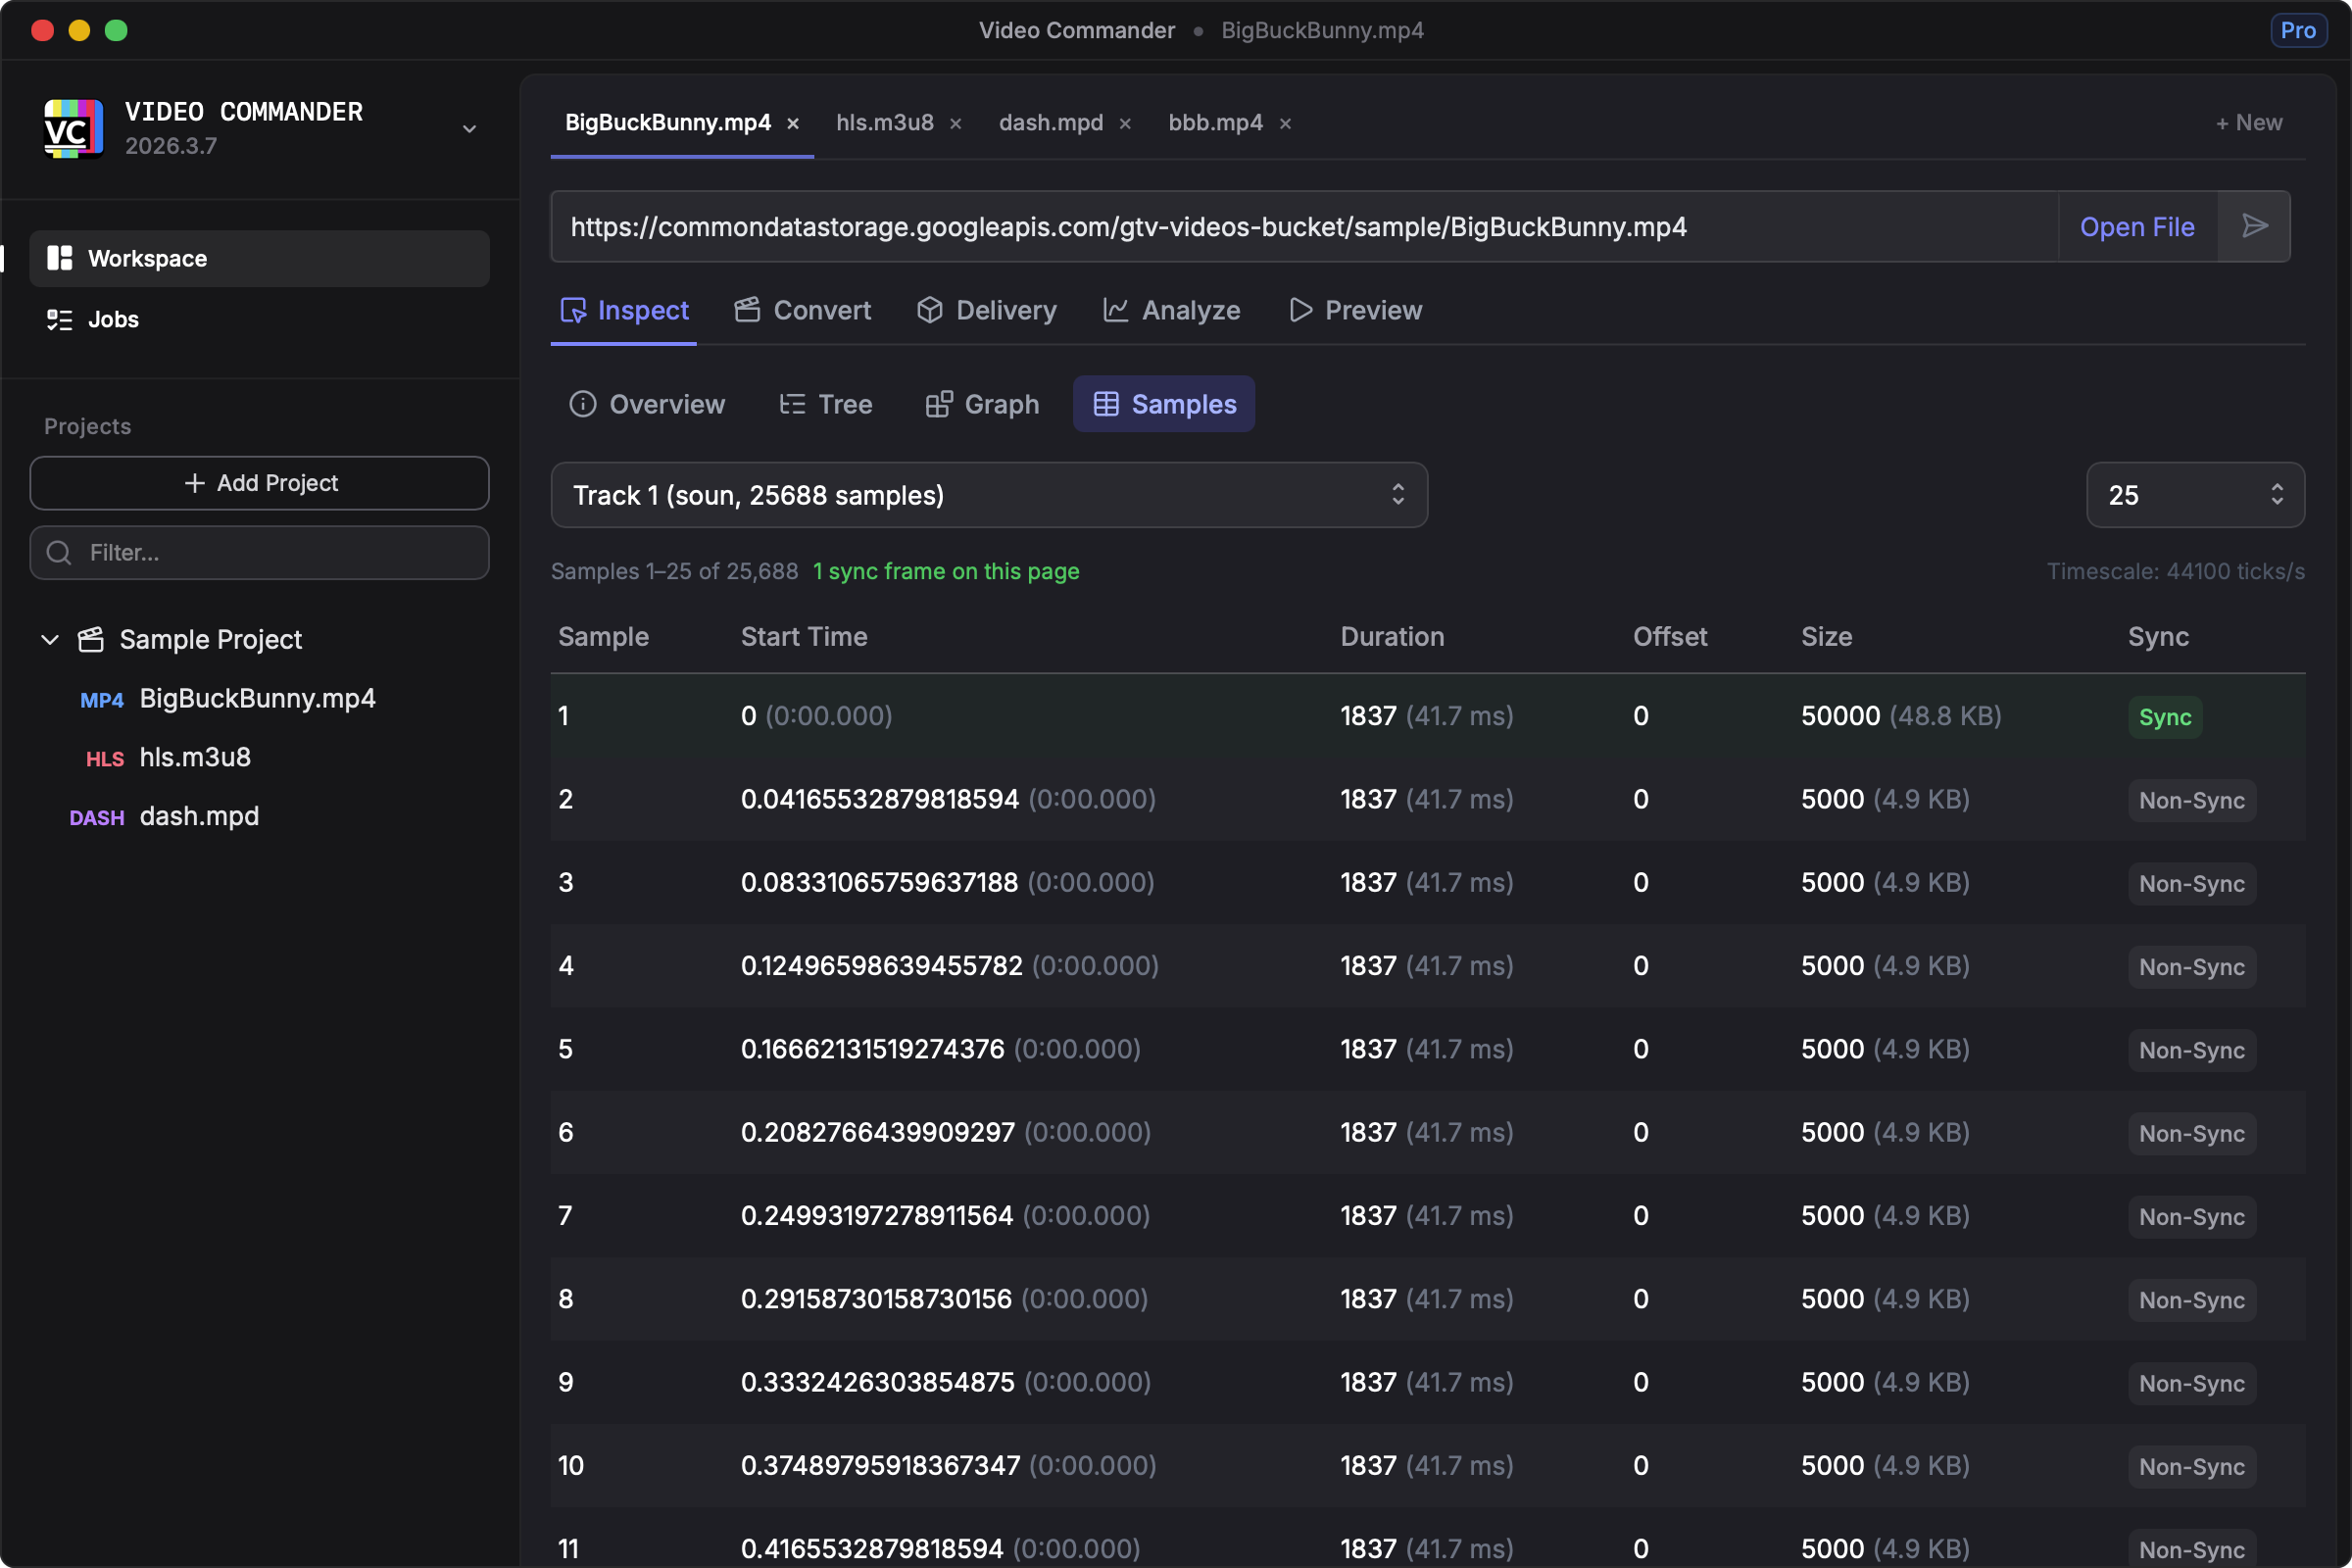
This is useful for diagnosing issues like missing keyframes, irregular sample durations, or unexpected gaps in the timeline. Things that don't show up in the overview but matter a lot when playback behaves strangely.
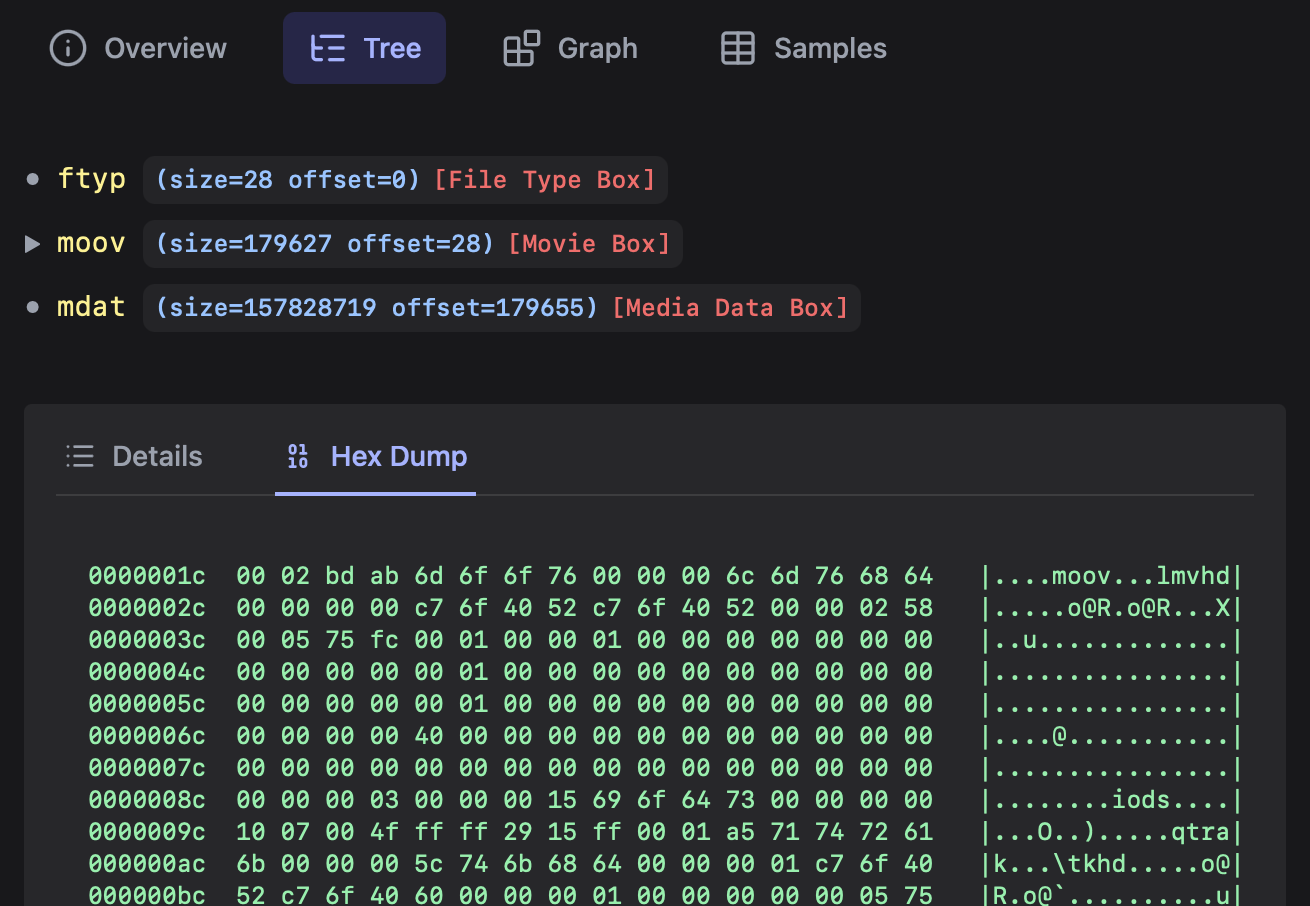
When You Still Need the Raw Data
Sometimes you need to see the actual bytes. The hex dump panel in the Box Tree lets you view the raw bytes for any selected box alongside the parsed field breakdown. It's useful when something looks wrong in the parsed output and you want to verify it against the spec.
Previewing the File
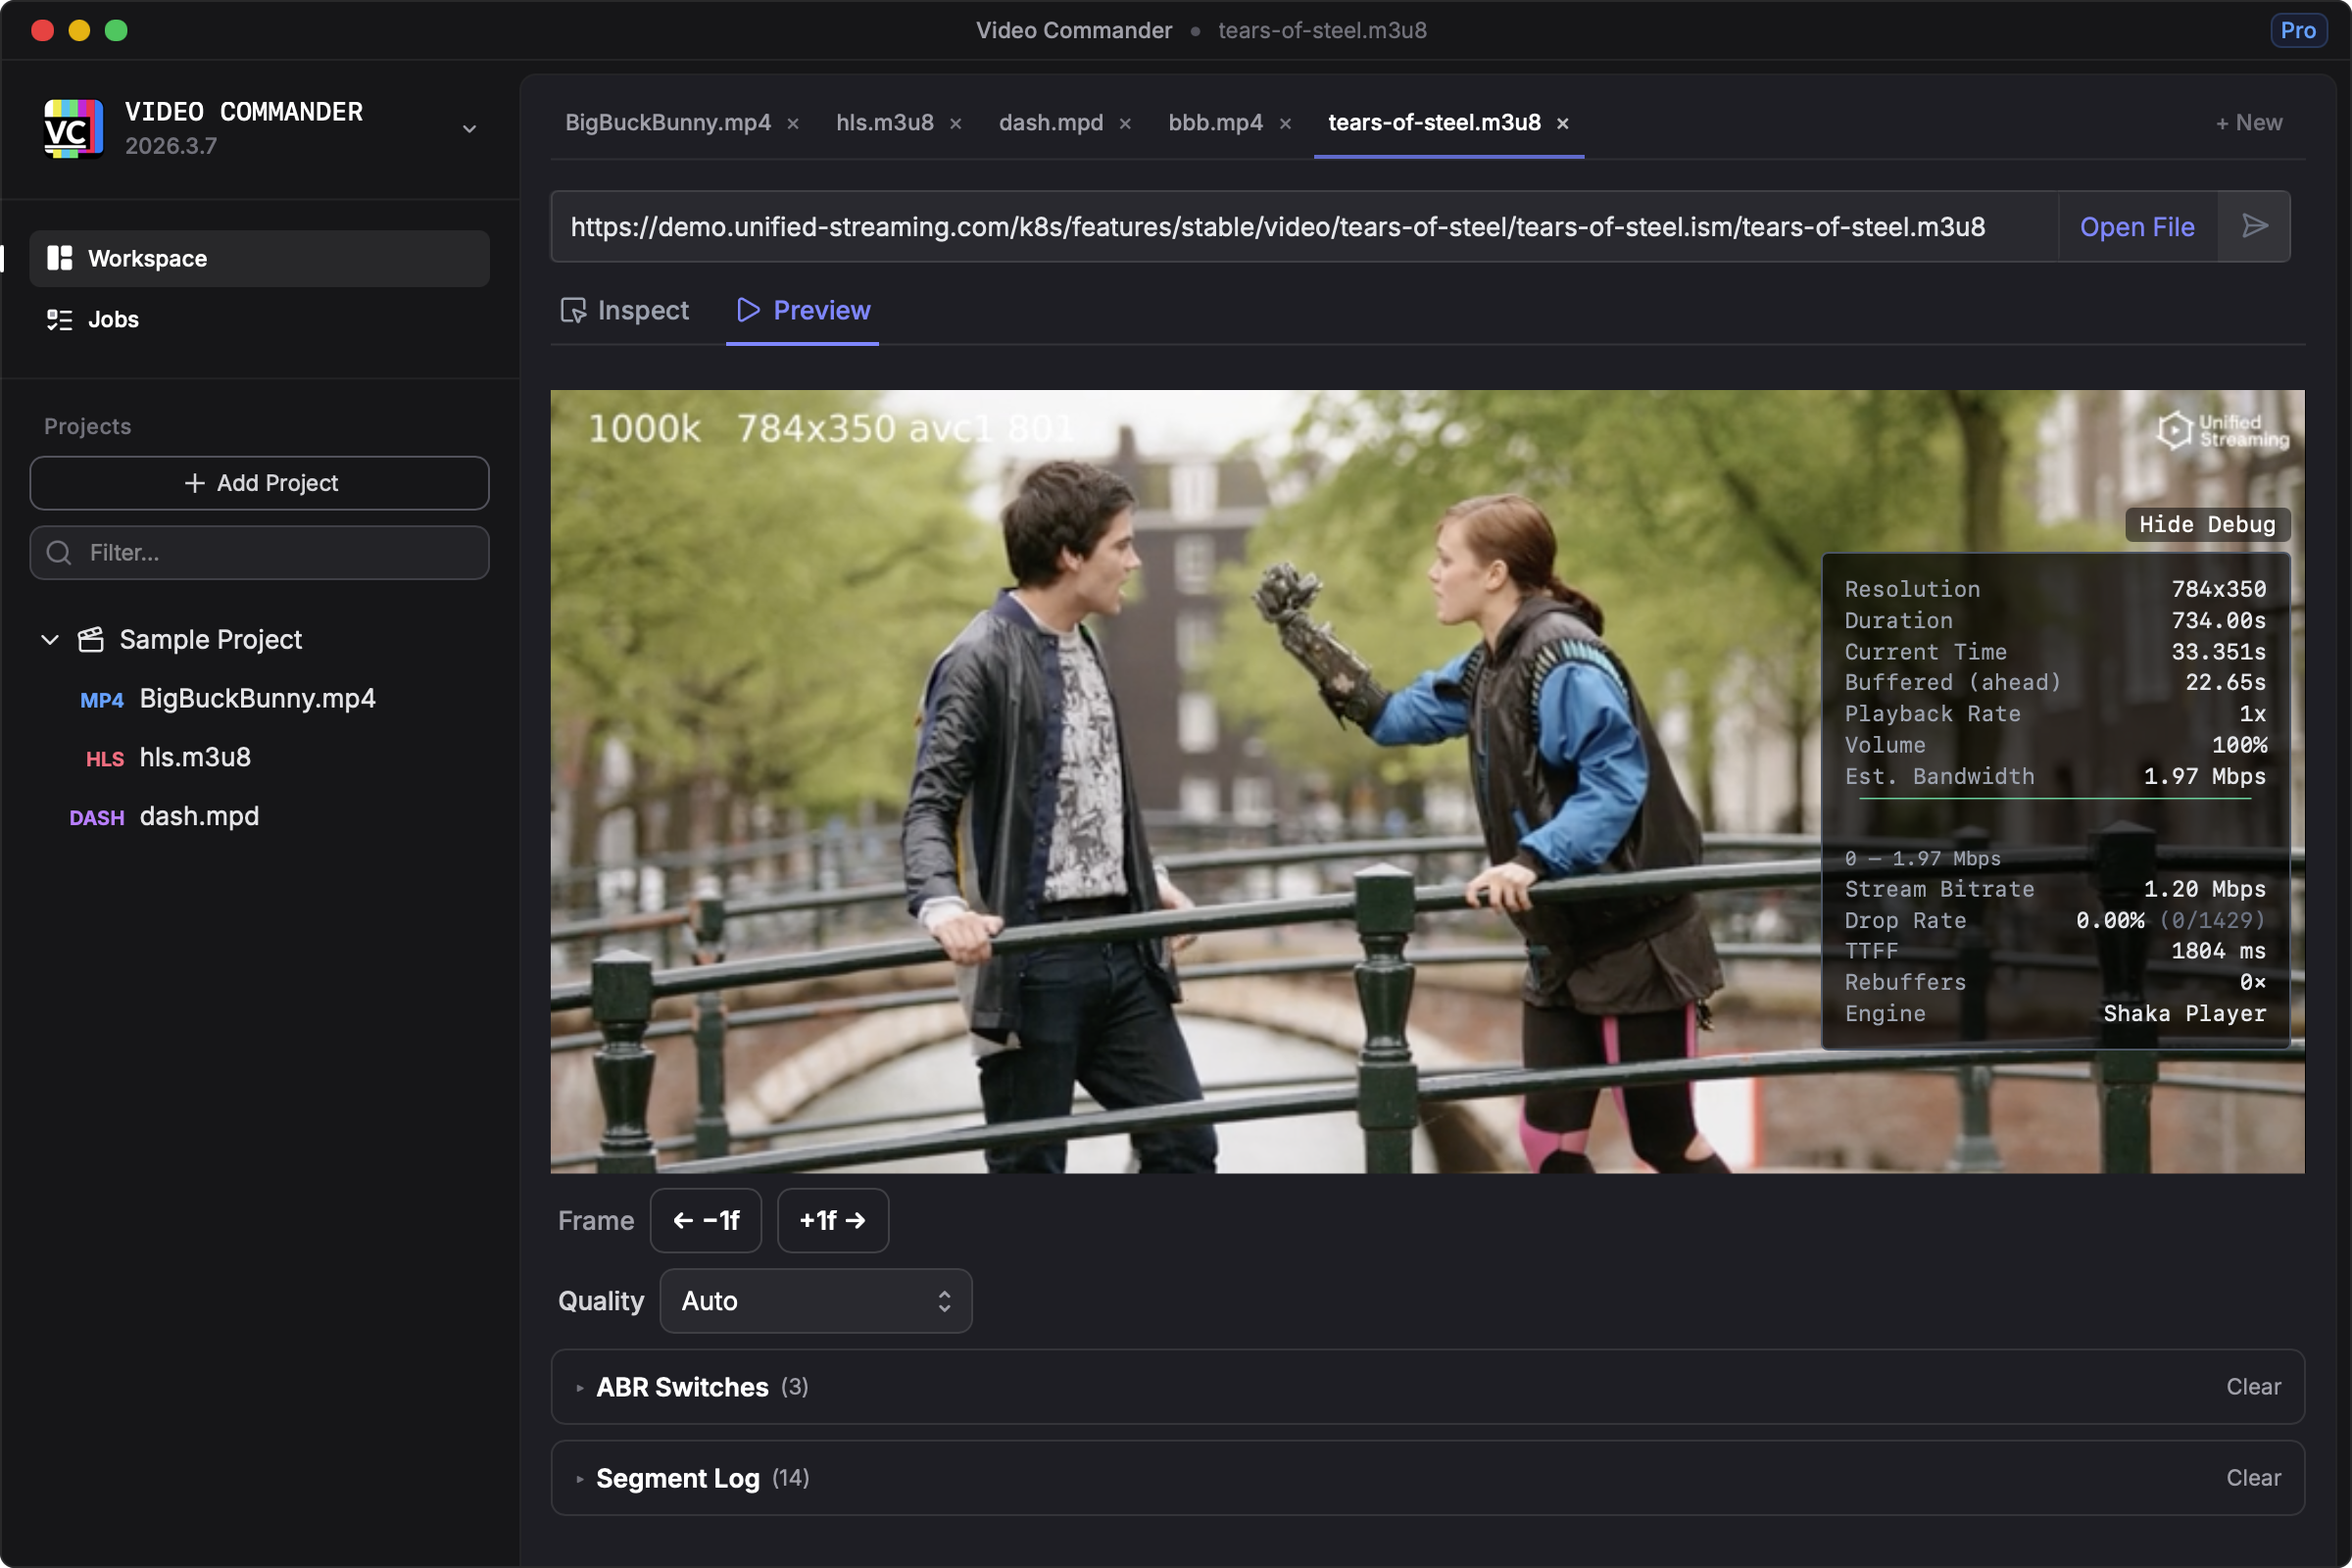
The Preview tab plays the file directly in the app using the native player, with an optional debug overlay that surfaces buffering state, dropped frames, current bitrate, and resolution. Useful for a quick visual check after you've looked at the structure.
The Short Version
- Codec, resolution, bitrate, duration — Overview tab
- Container box structure — Inspect → Tree or Graph
- Sample timestamps and keyframe layout — Inspect → Samples
- Raw bytes for a specific box — Box Tree → hex panel
- Visual playback check — Preview tab
Video Commander is available for Mac and Windows. Download it for free at video-commander.com/download.